In 2019, a new system for the visualization and control of a gas boiler room was installed at the Vitana company's production facility in the town of Varnsdorf.
The system was implemented by the JS stavby company in cooperation with Mr. Hromek, the Varnsdorf facility's power engineer. By doing so, the original control system (Honeywell Excel) – which had been in place for twenty years – was replaced.

A picture of a boiler room
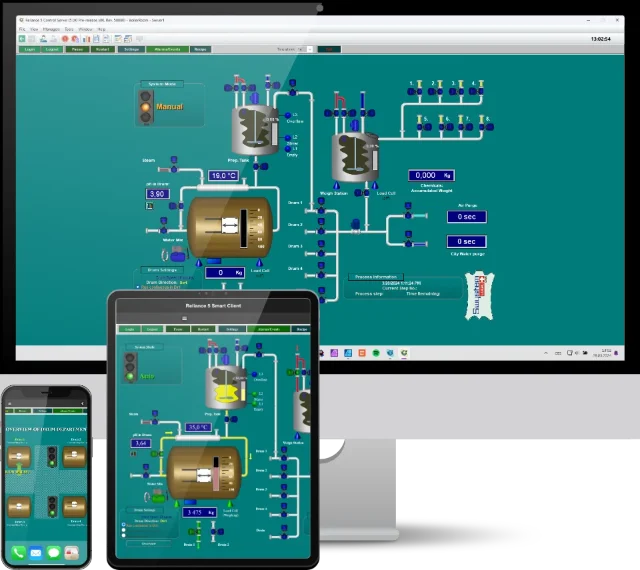
The system consists of the Reliance SCADA system and a Tecomat Foxtrot PLC. It was chosen for its modularity and for the fact that it can be expanded in the future (e.g., by adding HVAC control). This system was designed to take full account of the customer's requirements. It is tailor-made, so to speak, with an emphasis on energy savings.
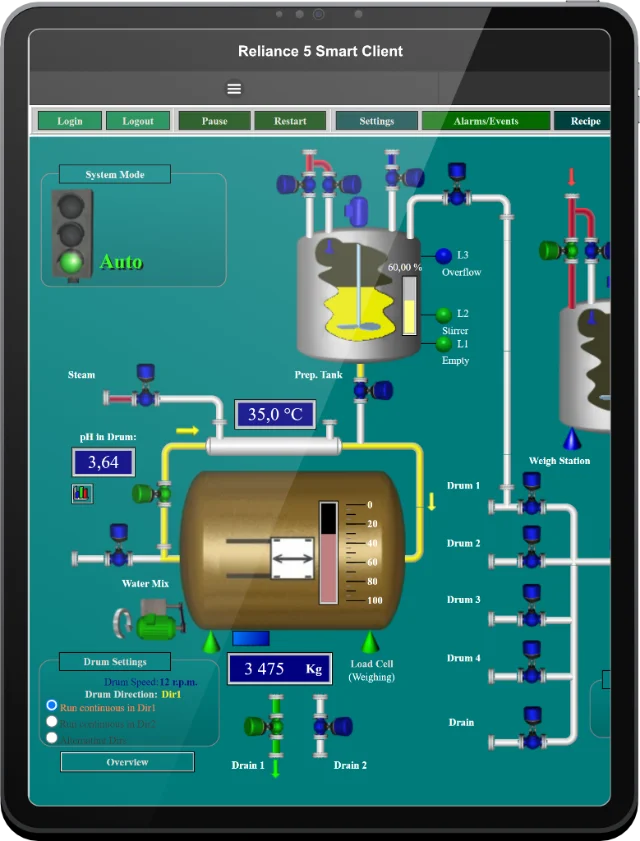
The gas boiler room operates an autonomous system that is controlled and visualized via an LCD panel. It includes all the functions and settings required for the operation of the boiler room. This Web interface allows access from the company's intranet.
WINNING INSTALLATION
This installation finished second in the Reliance Success Story Awards 2019 competition.
The Reliance SCADA system is installed on a separate computer. The visualization project provides operational information on the state of the boiler room (errors, alarms, temperatures, etc.). Unlike the previous boiler-room control system, the visualization project for the new one has one main screen. The previous solution with multiple screens was not ideal.
Other advantages of the new system are:
The project's help system consists of brief hints on how to configure and work with each visualization control. These hints were used to create the overall help system. Thus, there was no need to make a complex printed manual with a lot of text.
A great advantage is the possibility to create scripts, which opens up another level of automation options. The project contains scripts for logging data (room temperature measurement, heat consumption, burner operation, etc.) and for generating reports. Simple scripts are also used for moving equithermal curves, both the entire curve and the curve's points for manual adjustment. The equithermal curves' values can be recorded by a script once a day according to the current outside temperature, e.g., in the last 24 hours. The project is still under development, which opens up further possibilities for using scripts (e.g., weekend downtimes).

The main visualization window

A time program

Boiler settings

PID control tuning trends

Data export
The main visualization window
A time program
Boiler settings
PID control tuning trends
Data export
Country:
Title:
Implemented by:
Year:
Control system:
SCADA software:
If you have any questions, please feel free to email or call us.
Phone:
Info:
Sales:
Suppor:
Phone:
Info:
Sales:
Support:
Phone:
Info:
Sales:
Support:
GEOVAP
Cechovo nabrezi 1790
530 03 Pardubice
Czechia
© 2026 GEOVAP | Terms of Use and Privacy Policy | Cookie preferences | Write to us